The 2024 election is quickly approaching, and senior voters are gearing up to make their voices heard. In this article, we'll explore how America's seniors are planning to engage in the political process - from their top priority issues to the methods they'll use to cast their ballots. We'll also examine the crucial role that caregivers play in supporting senior voters and uncover potential accessibility challenges that could impact turnout. Whether you're a senior voter yourself or supporting an elderly loved one, this article will provide valuable insights to help prepare for the 2024 election season.
Key Takeaways
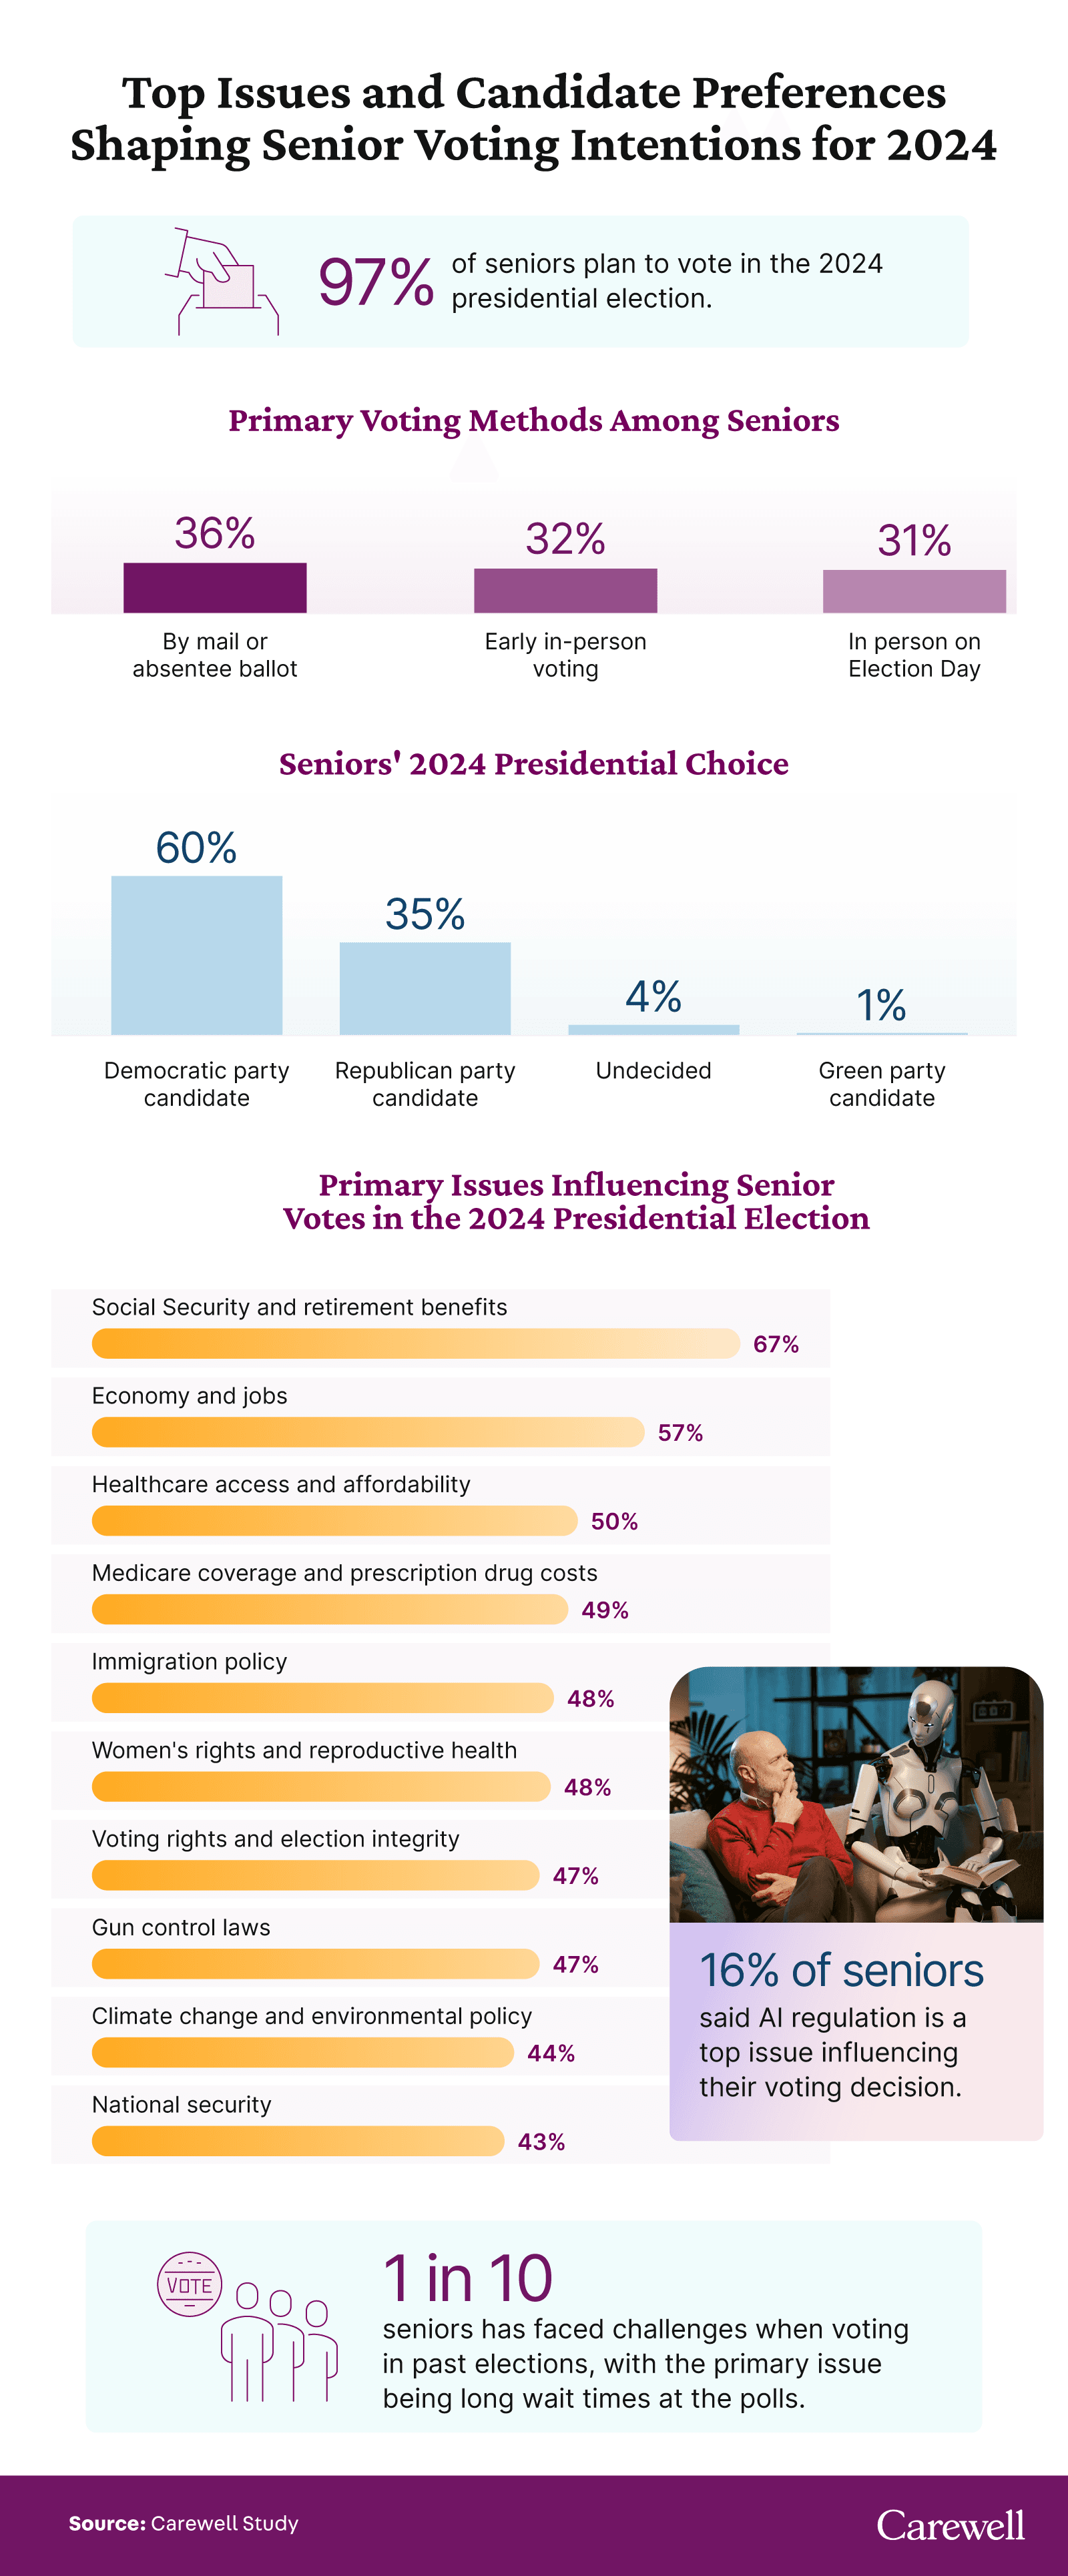
97% of seniors plan to vote in the 2024 presidential election.
Social security and retirement benefits (67%), economy and jobs (57%), and healthcare access and affordability (50%) are the top issues influencing seniors' vote in the 2024 Presidential election.
1 in 10 seniors has faced challenges when voting in past elections, with the primary issue being long wait times at the polls.
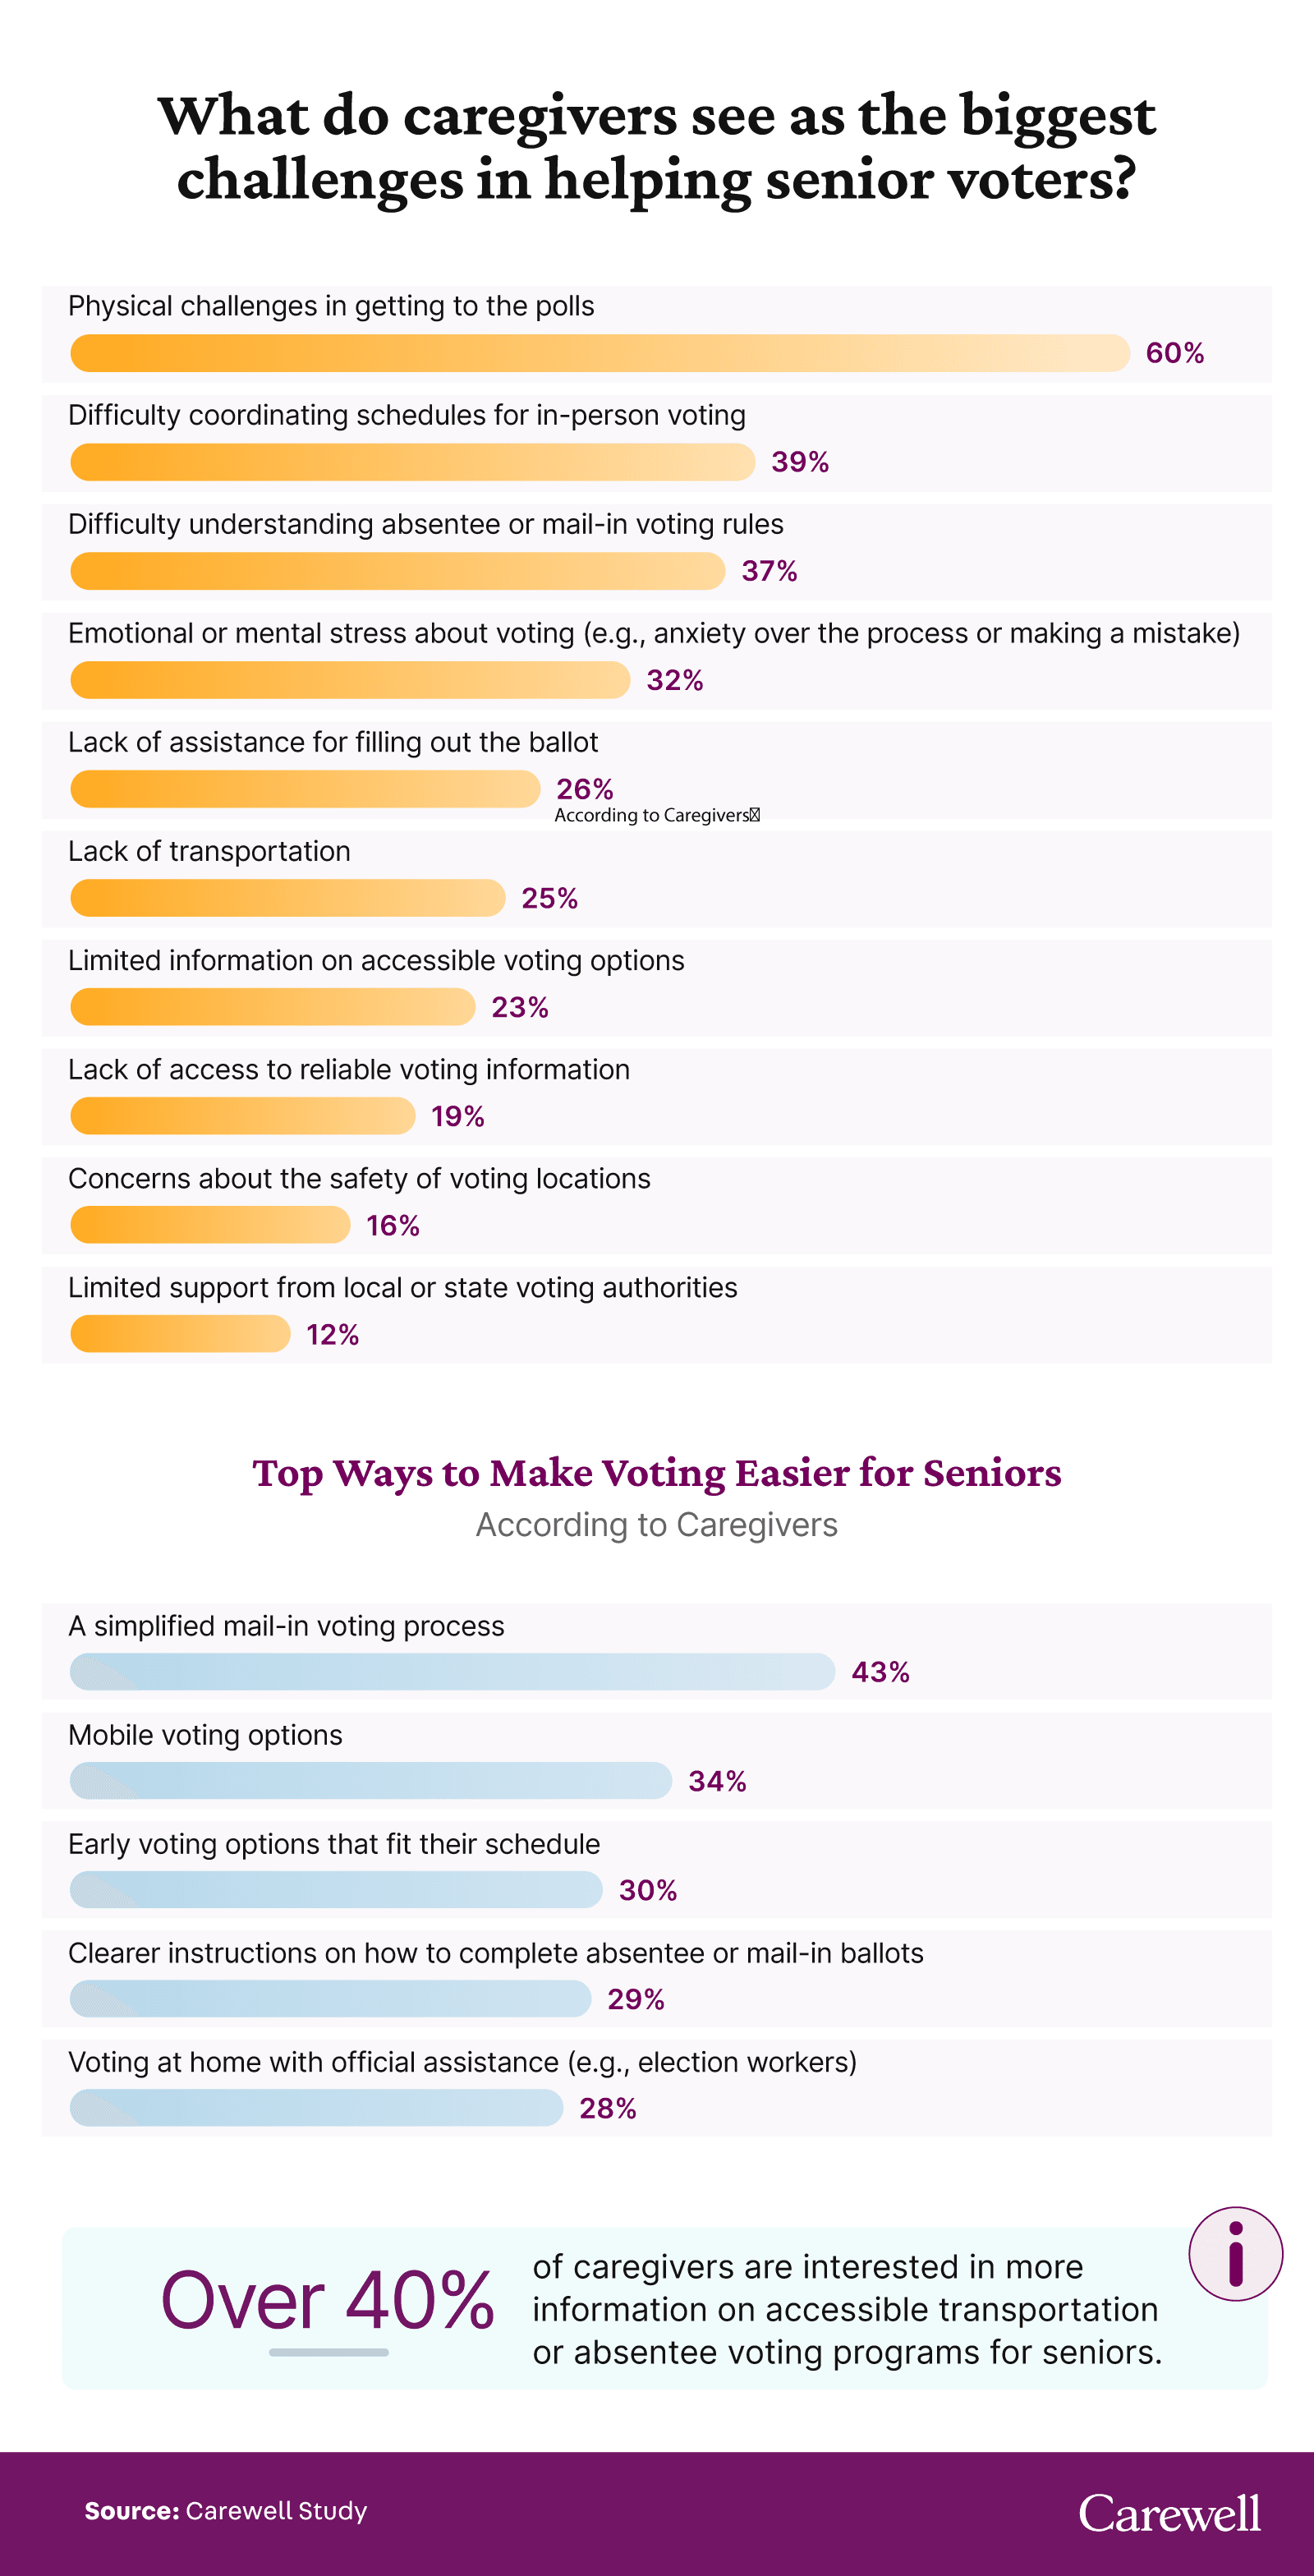
Over 40% of caregivers are interested in more information on accessible transportation or absentee voting programs for seniors.
Seniors' Top Priorities for the 2024 Election

97% of seniors plan to vote in the 2024 presidential election.
Social security and retirement benefits (67%), economy and jobs (57%), and healthcare access and affordability (50%) are the top issues influencing seniors' vote in the 2024 Presidential election.
1 in 10 seniors has faced challenges when voting in past elections, with the primary issue being long wait times at the polls.
16% of seniors consider AI regulation a significant factor in their voting decisions.
3% of seniors plan to Uber to the polls to vote in the 2024 Presidential election
Primary reasons seniors support their chosen candidate:
Trust in their leadership and experience - 72%
Alignment with value on social issues - 69%
Protection of Social Security and retirement benefits - 65%
They have a strong plan for the economy and inflation - 64%
Agreeance with their stance on immigration - 55%
Primary issues influencing senior votes in the 2024 presidential election by political affiliation:
Republican:
Immigration policy - 73%
Economy and jobs - 72%
National security - 59%
Social Security and retirement benefits - 58%
Voting rights and election integrity - 43%
Medicare coverage and prescription drug costs - 35%
Democrat:
Women's rights and reproductive health - 73%
Social Security and retirement benefits - 73%
Climate change and environmental policy - 67%
Gun control laws - 63%
Healthcare access and affordability - 61%
Independent:
Social Security and retirement benefits - 72%
Healthcare access and affordability - 58%
Economy and jobs - 56%
Medicare coverage and prescription drug costs - 52%
Immigration policy - 45%
Senior Support and Opposition on Key Issues
Medicare for all:
Student loan forgiveness
Universal basic income:
Federally legal marijuana:
The Role of Caregivers in Supporting Senior Voters

Over 40% of caregivers are interested in more information on accessible transportation or absentee voting programs for seniors.
Over 10% of caregivers have experienced challenges in helping seniors vote in the past.
1 in 3 caregivers are concerned about their senior's ability to vote due to health or mobility issues.
Nearly 20% of caregivers are aware of programs that assist seniors, and 27% of those have utilized these programs.
Primary ways caregivers support senior voting:
Reminding them to vote or discussing important deadlines - 38%
Discussing candidates and issues - 37%
Helping them understand voting options (early voting, absentee, etc.) - 32%
Providing transportation to the polls - 32%
Assisting with mail-in or absentee voting - 28%
Methodology
For this study, we surveyed 500 American seniors—both with and without caregivers—and 500 American caregivers to uncover their voting preferences, key issues, and candidate choices for the 2024 election. The average age among seniors was 66; 64% of respondents were women, 35% were male, and 1% were non-binary. Politically, 47% identified as Democrats, 29% as Republicans, 5% as Moderate, and 19% as Independent. The average age among caregivers was 41; 59% of respondents were women, 39% were male, and 2% were non-binary.
About Carewell
At Carewell, we know that caring for a loved one can be both rewarding and challenging. As a family-owned and operated business, we’re here to support you every step of the way. Our mission is to provide the products and resources you need to make your caregiving journey a little easier, so you can focus on what matters most: providing the best possible care for your loved one.
Fair Use Statement
We appreciate your recognition! Share this data for noncommercial use, but please link back here to acknowledge our work.


